Showing posts with label polls. Show all posts

Tuesday, December 09, 2014

Survey: Republicans Believe False Things

The title of this post is in reference to a Selzer poll conducted for Bloomberg Politics, described by Al Hunt.

A Bloomberg Politics poll shows that on two controversial issues, the budget deficit and deporting illegal immigrants, the public believes Obama's critics–even though reality favors the president.
By 73 percent to 21 percent, the public says the federal budget deficit has gotten bigger during the Obama presidency.
It hasn't.
By 53 percent to 29 percent, Americans believe that Obama has sent fewer undocumented immigrants home than were deported a decade earlier.
He has sent more.

On the surface, this is a sad statement about the knowledge the American public has about news.  But digging a little deeper, one finds that one party in particular is driving the results here.

Republicans by an 8-to-1 ratio say the budget deficit has grown over the last six years; a smaller majority of independents and Democrats say that. Likewise, 66 percent of Republicans say there have been fewer deportations versus only 45 percent of Democrats and 52 percent of independents.

There are subjective questions polling firms ask about how politicians are handling economic crises, or if one approves of a politician, and I basically ignore them, because there is no right answer. It's just an opinion. But then there are questions about basic facts, which are like examinations of poll respondents.  It is no longer "what do you think of this?", it's "what do you know about this?".  And this survey shows that being a Republican is strongly correlated with not knowing about both the budget and current immigration policy.


Monday, November 03, 2014

Last Senate Update

These are my final guesses for the U.S. Senate elections tomorrow.


If Orman wins and caucuses with the majority, he'll likely choose to team up with Republicans, since he's probably not foolish enough to base his decision on a result that happens before potential runoffs in Louisiana and Georgia determine control of the senate for sure.  This is of course assuming he wins, which, let's face it, would be really weird, despite the polling on the Kansas senate race saying Orman has a narrow lead.    Still, an algorithm is an algorithm, and mine shows Orman up a percentage point on Pat Roberts.


Friday, November 09, 2012

State Poll Results: Mason-Dixon, Rasmussen Duke it Out for Last Place

So which pollsters were the best and which were the worst? That depends on how you want to analyze things. 

I'm not a statistician or anything, so my analysis can only be very rudimentary. But here it is.

I took only the final state polls from every pollster I had in my database*.  The most recent final poll was from the day before election, the oldest from September 13 (Quinnipiac poll of New York), but most were from October and November.  I used the pollster's spread as the metric by which to measure it against the actual election's percentage spread as of Friday morning.  I calculated a house effect for each poll (predicted minus actual) and an error for each poll (absolute value of predicted minus actual); averages were the sum of each poll's house effect / error divided by the number of final polls that pollster did.

I analyzed every pollster's final poll, but I focus on the eleven pollsters with five or more states in this analysis. 

By the lowest average error metric, Marist won, with PPP second.  Mason-Dixon was by far the worst, with Rasmussen being the second worst.


The most centrist national pollster ended up being Pharos.  Pharos was also the only pollster with a left-leaning house effect on average over all presidential and senate polls.  Everyone else tilted right of actual results, even PPP.  The most partisan pollster on the right?  ARG (4 points).

______________________________________

You could also say a quality pollster is the one which has the most number of guesses within some given number of points. 


The spread in every single final Marist poll was within 5 points of the actual result in both the presidential race and the senate race, which is a pretty amazing accomplishment.  By contrast, fewer than half of Mason-Dixon's polls were within five, also an amazing accomplishment really.

Quinnipiac had the best senate poll on-the-nose mark (3 of 8 within a point), Gravis (amazingly) had the best presidential on-the-nose mark (3 of 11 within a point), but PPP had the best combined on-the-nose mark (9 of 35).  Mason-Dixon was not within a point in any of its 15 final polls (president or senate), though Rasmussen's 2-for-38 mark deserves some special scorn as well just because they had so many more chances than the rest. 

Pharos was within three points of the final margin 9 out of 14 times.  For comparison, Mason-Dixon was within three points only 2 out of 15 times.

_________________________________________

Another way you can take the measure of the best and the worst pollsters is by the number of battleground races that they call better than anyone else, because really it's the battleground races that most people focus on.  So I looked at the presidential races in the battleground 9 states plus the expanded map 3 states of Minnesota, Michigan and Pennsylvania.  I also looked at the 14 closest senate races plus Nebraska. 

The overwhelming winner by this standard: PPP.

(1 * indicates a pollster was the best or tied for the best national pollster in the given race, but not the best pollster. 2 ** indicate the best or tied for the best pollster. 1 ? indicates a pollster was the worst or tied for the worst national pollster in a given race, but not the worst pollster. 2 ?? indicate the worst or tied for the worst pollster.)


PPP was tops among national firms in 15 races: Colorado, Florida, Michigan, Minnesota, New Hampshire, Nevada, Nevada senate, Virginia, Virginia senate, Wisconsin senate, Arizona senate, Connecticut senate, Montana senate, New Mexico senate and Pennsylvania senate.  They were the worst only in the Ohio senate race (showing a 10 point Sherrod Brown win when it was only 5.2 points).

Conversely, Rasmussen was the worst national firm in 10 races, Colorado, Iowa, Virginia, Wisconsin, Wisconsin senate, Arizona senate, Massachusetts senate, New Mexico senate, North Dakota senate and Pennsylvania senate.  They were the best in only three races (New Hampshire, Pennsylvania and Indiana senate) (interesting that they were both the best and the worst in Pennsylvania: Rasmussen's 5-point Obama win was almost dead on, but the 1-point Casey win was 8 points lower than reality).

____________________________________________
 
So you can pick your own best and worst from this info.  It's pretty clear to me that the best pollsters were PPP and Marist, and the worst were Rasmussen and Mason-Dixon. 

I look forward to seeing Nate Silver's pollster ratings.

*my database excluded a few polls for reasons of methodology that in hindsight I wish I had included, including Mellman polls. 


Thursday, November 08, 2012

My Election Prediction Report Card

I know you all are wondering how my predictions stacked up against reality.  No? Well, I'm going to tell you anyways: not that great.  Certainly not Nate Silverish.  Here's a graph of my prediction of the margin versus the actual margin in each state.


The worst prediction in terms of margin was Hawaii (the topmost dot), where two polls led me to guess an Obama margin of 27 points that was actually 15.8 points too Republican. 

Here's the same graph zoomed in on the battleground states.


My prediction for every battleground state except Ohio was too Republican.  The median poll spread method I chose called Michigan a 3 point state (ludicrously).  The real margin was 8.5 points.  Iowa, Colorado, New Hampshire, Nevada -- all these states went more than 3.5 points more for Obama than I had predicted using the median poll spread.  The model got the call on Florida wrong, and it predicted only a tie for Colorado, which wasn't even the next closest state (Ohio was). 

On average, my guesses had a 1.6 point Republican house effect overall, but a 3.3 point Republican shift in states that went for Barack Obama.   

The worst prediction in terms of margin was Hawaii, where two polls led me to guess an Obama margin of 27 points that was actually 15.8 points too Republican (the real margin was 42.8). 

As bad as my results were in the presidential race, my results in the 33 senate races were worse.


There is a systemic leftward shift in that data, which means the actual results were more Democratic than I had predicted.

Here's the same graph zoomed in on the battleground states.


 I predicted a 6 point race in Missouri (that dot way at the top of the zoomed in map) that was actually a 15.5 point walloping by Sen. Claire McCaskill.  The model only missed on Heidi Heitkamp; I had predicted a 4 point loss.  But my average error more than makes up for the fact that it correctly called 32 of 33 races: I had a house effect of 4 points towards Republicans.  The only Democrats who won by less than my prediction were Sens. Sherrod Brown, Martin Heinrich and Tom Carper, and I was too kind to Bob Kerrey, who lost to Sen.-elect Deb Fischer by a huge margin.  But that's it. Only four races out of 33 were redder than I expected, and 29 were bluer.


Tuesday, November 06, 2012

It's Election Day!


Well, Dixville Notch already voted, so I guess I'd better make official predictions.  My method predicts 303 electoral votes for Obama (actually 294 with a tie in Colorado, but I'll wager that Colorado goes blue) and 54 senate seats for Democrats.

  • I didn't add polling data from the states shaded gray in my database -- either due to no polls, no credible polls, me being lazy and not adding in uncompetitive states, or not wanting to deal with three-way senate races (MD, ME) -- so the spread I'm forecasting in those states is just my best guess. 
  • I'm predicting Oklahoma will not be the most conservative presidential-voting state this year.  I predict those "honors" will belong to Utah this year. 
  • My official guess will be based on spread, not Obama's total or Romney's total.


And the senate races.  There's a huge gap between the 58th senate seat (Nebraska) and the 59th (Texas).  If Democrats manage to upend polling convention by 20 points, opening up holes to long-established mathematical laws and basically breaking the entire field of statistics, they still will only get 58 seats. Also, no way do I think Ted Cruz will only get 52% of the vote, and even a 20.5% victory seems low.


Sunday, November 04, 2012

Senate Polls - The Final Weekend

As we head into the final polling days before election day (48 hours!), the senate races have mostly only gotten better for the Democrats.  Before this election cycle, the consensus was that the Republicans would take over the senate due to Obama's negative favorability rating combined with a stacked deck of blue seats on the line.  But Republican candidates have totally screwed the pooch this year due to their rape gaffes basically. That recent large uptick in the average median poll spread graph was due entirely to Richard Mourdock.

The median poll spread shows Democrats increasing their majority in the senate by one seat to 54.  The biggest caveat to that is the fact that it still shows Dems picking up Arizona, where there were only three polls released in October (and where there will be at least one new poll released today). On the other hand, it shows Heitkamp and Tester losing in North Dakota and Montana, so one could argue that it is actually not strong enough for Democrats.

(For the presidential race graphs, click here)

WEST (LOW INFORMATION) REGIONAL


North Dakota (R+4) (based on 4 latest polls from Mason-Dixon, Pharos, Rasmussen and Forum/Essman) - Far too few polls to really judge what's going on.  Two polls came out last week: one showed Heitkamp up two, one showed Berg up two.


Arizona (D+1) (based on 3 latest polls from Rasmussen, BRC and PPP) - No polls came out this past week. Do Arizonans not have phones?


Montana (R+0.5) (based on 4 latest polls from Rasmussen, Pharos, PPP and Mason-Dixon) - This is another circumstance where my methodology gives a weird result.  There hasn't been a poll showing Denny Rehberg on top of Jon Tester since a September 23 Mason-Dixon poll (a new one will come out today or tomorrow).  But Tester's numbers are (45, 46, 48, 49) and Rehberg's are (44, 47, 48, 48), Rehberg is up by a half point.


Nevada (R+1) (based on 6 latest polls from Survey USA, Marist, PPP, Rasmussen, Suffolk and WeAskAmerica) - There was only one new poll last week, by Survey USA, and it showed Heller up 6 on Berkley.  Berkley hasn't been up in a poll since September 25.  I think this one point margin is too close.


MIDWEST (RAPE GAFFE) REGIONAL


Missouri (D+4.5) (based on 4 latest polls from WeAskAmerica, Mason-Dixon, PPP and Rasmussen) - The grandaddy of all rape gaffers, Todd Akin continues to trail in polls including two released this week.  No poll has shown an Akin lead since that fateful day in August when he gave that interview to KTVI in St. Louis.


Indiana (D+5) (based on 3 latest polls from Rasmussen, Howey/DePauw and Pharos) - Finally two independent polls were released last week, both showing pro-lifer Joe Donnelly leading pro-lifer Richard Mourdock, but despite having the smaller lead shown for Donnelly, it was the Rasmussen poll that was the most effectual in moving the spread from Mourdock+4 to Donnelly+5.


Wisconsin (D+2) (based on 8 latest polls from PPP, WeAskAmerica, St. Norbert, Marist, Rasmussen, Marquette, Mason-Dixon and Quinnipiac) - Seven new polls were released in Wisconsin this past week, and Tammy Baldwin led in all but one of them, an unusual poll from St. Norbert that showed Obama winning by 9 (4.5 points above the median) but Baldwin losing by 3.  Still unexplained, at least to me, is why there was a rape-gaffe-like plummet in Tommy Thompson's numbers in September.  


Nebraska (R+7.5) (based on 4 latest polls from WeAskAmerica, Gravis, Pharos and the Omaha World-Herald) - The Omaha World-Herald poll from October 27 showing Deb Fischer up by only 3 is single-handedly responsible for WeAskAmerica and Gravis's entrance into Nebraska's polling universe.  Predictably these polling firms showed Fischer way up (by 12 and 13).


NORTHEAST (HURRICANE RAVAGED) REGIONAL


Pennsylvania (D+6) (based on 9 latest polls from PPP, Susquehanna, Franklin & Marshall, Philadelphia Inquirer, Rasmussen, Pharos, Muhlenberg, Quinnipiac and Siena) - Pennsylvania recovered enough from the power outages caused by Hurricane Sandy to have two polls released today, but unfortunately one of them was from Susquehanna, the worst, most partisan independent polling firm in my database.  But the one-point lead they showed for Casey was actually an improvement from an earlier more outlandish poll.  Other than that earlier Susquehanna poll, no poll has shown Tom Smith with a lead since ... ever.


Connecticut (D+4) (based on 7 latest polls from PPP, Rasmussen, Mason-Dixon, Quinnipiac, Survey USA, UConn and Siena) - One post hurricane poll was released this week showing Chris Murphy with the largest lead of any independent poll this cycle, 9 points.  Interestingly, Linda McMahon's median line looks like the southern border of Oklahoma.  This is only bad news for her, as she is now in the part of the Red River that starts to turn south towards Shreveport.


Massachusetts (D+3.5) (based on 8 polls from PPP, Kimball, Suffolk, Boston Globe, Rasmussen, MassINC, Western New England U., and UMass) - There were four polls that came out last week, and they were a mixed bag.  Probably the most surprising was a Boston Globe poll that showed a tied race when they had shown Elizabeth Warren up 5 a month before.  Still, the other non-partisan polls looked good for Warren, and Rasmussen's latest even showed her up 5.


FLOHVA (OF LOVE) REGIONAL


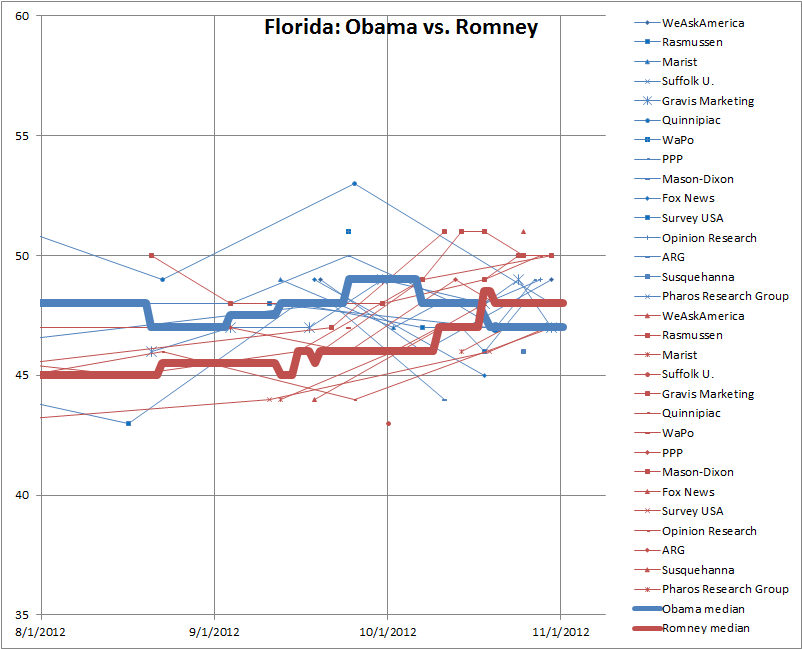
Florida (D+6) (based on 13 latest polls from Marist, Mason-Dixon, WeAskAmerica, Gravis, Quinnipiac, Survey USA, PPP, Rasmussen, Susquehanna (VSS), Pharos, Fox News, Suffolk, and the Washington Post) - This race is over and has been for a long time.  But the chart looks like a left-facing alligator, or maybe a sparkplug, so it's still interesting.


Ohio (D+6) (based on 13 latest polls from Columbus Dispatch, Marist, Rasmussen, U. of Cincinnati, Quinnipiac, Survey USA, Pharos, PPP, Gravis, Suffolk, Fox News, WeAskAmerica and the Washington Post) - 11 new polls came out this week and none of them showed Josh Mandel with a lead, though a Rasmussen poll went full-on Republican and called the race a tie.  More intriguingly, a Marist poll put Sherrod Brown up by only 5, still not exactly a toss-up but much closer than expected (the same poll had Obama up 6, making this one of only four polls in my database showing Obama polling ahead of Brown.  There are 62 Ohio polls in my database).  It still looks like Brown will win comfortably, but it is less of a slam dunk than in prior weeks.


Virginia (D+3) (based on 9 latest polls from WeAskAmerica, Roanoke College, Quinnipiac, Gravis, Washington Post, Rasmussen, PPP, Marist and Suffolk) - It actually was not a good polling week for Tim Kaine.  There were three polls released: up 4, down 5 and tied.  The movement in the median spread reflected undecideds finally choosing one way or another more than anything else.  Overall neither Kaine nor Allen really has any polling momentum going into the final three days of the campaign. 


But even the Unskewed Polls guy is apparently saying Democrats will win a majority.  


Saturday, November 03, 2012

Presidential Polls - Weekend Before Election Day

I wrote a couple weeks ago a couple days after the third presidential debate about momentum and how Mitt Romney's momentum from the first debate was very much real and very much continuing in his direction.  The margin for Barack Obama in swing state polls had slipped from an average of 4% to about 1%.

As if to prove me wrong, that week Romney's momentum stopped. Ever since the third debate, there has been no movement towards Romney in the swing state polls: Ohio has held firm for Obama, and the Great Lakes states have all shown constant or improving poll trends for Obama (except for my weird Michigan numbers). Still, the fact that Obama is still only up 1% in the swing states means that it will still be a close election despite the fact that it is clear Obama has the advantage.

The following are the median poll spreads in the nine battleground states plus Romney's "extended map" states of Michigan, Pennsylvania and Minnesota, in order of how they would swing right now.

(I'll have more on the U.S. Senate races in a separate post).

Mitt Romney starts with a baseline of 191 electoral votes including Montana, Arizona and Georgia, states where Obama has a good shot at being within single digits.  His likeliest battleground state pickup is ...

North Carolina (R+3) (based on 9 latest polls from PPP, Survey USA, Elon, Rasmussen, Civitas, Gravis, ARG, Marist, and Purple Strategies) - The Survey USA poll that showed Romney up by 5 was the most effectual poll of the week, and while PPP and Elon call the race tied, no polling outfit has shown a result with Obama on top since the previous Survey USA poll one month ago.  


Florida (R+1) (based on 15 latest polls from WeAskAmerica, Gravis, Quinnipiac, Survey USA, CNN/ORC, PPP, Rasmussen, Susquehanna (VSS), Pharos, ARG, Fox News, Mason-Dixon, Marist, Suffolk and WaPo) - There were 9 polls this week, and Mitt Romney was at or above 50% in 6 of them.  Florida still could go either way though; every single poll published in the last two weeks by firms that have house effects less than R+2 has shown the margin no more than 1% either way. 


As of right now, this is all my model shows Romney getting, 235 electoral votes.  But there are ties.

Colorado (tied) (based on 12 latest polls from PPP, Survey USA, CallFire, CNN/ORC, Rasmussen, WeAskAmerica, ARG, Purple Strategies, Marist, Gravis, Quinnipiac and the University of Denver) - Prior to today my model had shown Colorado in Romney's tally for 11 straight days, but in the past three days six polls were released, and five of them showed leads for Obama.  The most meaningful may be the poll from Wednesday from the conservative firm WeAskAmerica that showed Obama up by three.  The polling results from Colorado this week are what one could expect from a candidate with momentum, and that candidate is not Mitt Romney.


Virginia (tied) (based on 12 latest polls from WeAskAmerica, PPP, Roanoke College, Quinnipiac, Gravis, WaPo, Purple Strategies, Fox News, Rasmussen, ARG, Marist and Suffolk) - 7 new polls this week, and only one of them showed a Romney lead (that crazy Roanoke College poll).  For Obama the best poll might have been the WeAskAmerica poll today that showed him up by 1 despite having an unusually rightward tilt shown by the senate race numbers (George Allen up on Tim Kaine by 0.8).    


Even if you assume Romney stops the Obama momentum and wins these ties, he only has 257 electoral votes, 12 shy of victory.  But it is not looking good for him anywhere else.

New Hampshire (O+2) (based on 8 latest polls from New England College, Gravis, Marist, PPP, Rasmussen, ARG, UNH and Suffolk) - Four new polls this week all showed Obama with leads, including today's poll from New England College showing Obama up 6, the largest lead a non-UNH poll has shown since a Marist poll on September 25th had him up 7.  There were two days last week when my model showed Romney tied with Obama in New Hampshire, but now the polls are indicating that the momentum is with Obama.


Michigan (O+2) (based on 7 latest polls from PPP, Rasmussen, Epic-MRA, Detroit News, Baydoun/Foster, Gravis and MRG) - The biggest numerical anomaly.  Despite having only one poll show the race any tighter than 3 points, the median Obama number (47, 48, 48, 48, 50, 52, 52) minus the median Romney number (42, 42, 45, 46, 46, 47, 47) gives a result of O+2.


Nevada (O+3) (based on 9 latest polls from Survey USA, CallFire, Gravis, Marist, PPP, Rasmussen, ARG, Suffolk, WeAskAmerica) - There were only three new polls this week, and they've shown the same results as every other Nevada poll I have in my database: Romney not leading, but Obama not pulling huge numbers.  Nevada is a state with a tight race, but it is not a swing state.


Iowa (O+3) (based on 8 latest polls from Gravis, CallFire, Rasmussen, Marist, WeAskAmerica, PPP, ARG and the Des Moines Register) - There were six polls that came out in Iowa in the last three days and only one of them (Rasmussen) showed a Romney lead.  Gravis is the Republican-leaning pollster showing the largest margin for Obama right now, 4 points.  This is another state where Obama seems to have momentum.


Ohio (O+4) (based on 17 latest polls from WeAskAmerica, Rasmussen, CNN/ORC, U. of Cincinnati, PPP, Quinnipiac, Survey USA, Pharos, Gravis, Purple Strategies, ARG, SBSI, Suffolk, Fox News, Marist, Columbus Dispatch and WaPo) - Ohio gets the most attention from pollsters this year, but it is not swinging right now.  12 new polls came out this week, and Romney was only up in one of them, a Rasmussen poll on Monday that showed him up 2 points.  On Friday Rasmussen showed the race tied.  Obama doesn't have momentum here only because he's been leading by the same 3-5 point margin for the last two or three weeks.


Pennsylvania (O+4) (based on 10 latest polls from Franklin & Marshall, Philadelphia Inquirer, Rasmussen, Pharos, Gravis, Muhlenberg, Susquehanna, Quinnipiac, PPP and Siena) - There was only one poll released this week after Hurricane Sandy made landfall, and it used data from before the disaster.  Still, prior to the hurricane Pennsylvania was like Nevada; a close-ish state but definitely not a swing state.


Wisconsin (O+4.5) (based on 8 latest polls from WeAskAmerica, St. Norbert, Marist, Rasmussen, Marquette, PPP, Mason-Dixon and Quinnipiac) - Six polls released in the past three days, and none of them showed Romney with a lead. Wisconsin had looked like a possible non-Ohio alternative route to 270 electoral votes for Mitt Romney at one time, but Wisconsin provided Obama with arguably his best results from any state this week.  With maybe the exception of the Marist poll that only showed Obama up 3, every single poll this week was a pleasant surprise for Obama fans.  First PPP showed Obama up 5, then Marquette showed him up 8, then Rasmussen couldn't even tweak the numbers enough to show a Romney lead, then the NPR station showed Obama up 9, and finally the Republican WeAskAmerica showed an amazingly large 7 point lead. 


Minnesota (O+7) (based on 5 latest polls from PPP, Survey USA, Mason-Dixon, Rasmussen and St. Cloud St.) - I only started charting Minnesota because the Romney campaign has claimed it can win there based on Mason-Dixon's polling. But Mason-Dixon is the only firm that has shown Obama with less than 50%.  This state has been in the bag for Obama since the time Minnesota let Mondale supporters into the electoral college.


There are other states where Romney will keep it in single digits (Oregon, possibly New Mexico, possibly Connecticut).


Thursday, November 01, 2012

Pollster House Effects

I've talked about house effects against my median poll spread in brief before, but I haven't revealed my calculated list in full until now.  But first, some methodology.

The median poll spread is the difference between the median Obama number and the median Romney number.  These numbers may come from two separate polls; it is not the most central spread of any single poll.  When I first started keeping track of polls in September, I didn't really think much about how I'd choose the polls to put into my database.  I just used whatever polls were in the RealClearPolitics database, though I did not include polls marked with the partisan tag (except for PPP polls).  As I got into it more, I learned that RCP didn't always include PPP polls if they weren't independent; that is, if they were produced for left-leaning organizations.  But aside from maybe the wording of some of the questions that occurred after the presidential survey, these polls were no different than the usual ones PPP included, and I decided it wouldn't be fair to state that PPP's latest guess was a poll produced two weeks ago when really they had just done one yesterday.

And then I discovered all the polls in Huffpost Pollster, and then Pharos Research Group, and then Steve Singiser's daily roundup of polls that I had never heard of or considered before, and so I realized I needed a better methodology to selecting the polls.  Here's what I've got so far:

Include all polls except:
  1. Polls produced for political parties or individual campaigns
  2. Polls produced for advocacy organizations (except PPP) (so, no Grove, Lake or Mellman polls)
  3. Internet polls (no real reason, just that RCP doesn't use them)
  4. Class assignment academic polls (with long period of time in the field and/or small number of responses) (the Old Dominion poll and the U. of Iowa poll are the only two to fall under this exception)
  5. Polls that only report registered voters instead of likely voters after September (one High Point poll in North Carolina was excluded).
  6. Any poll with the word "Newsmax" in it.
I wish I could say there was more science behind the methodology, but it's been more ad hoc and hunch than scientific.  More sophisticated poll averagers use weighting, emphasizing the quality polls and minimizing partisan polls, but since I use a median instead of a mean, each poll has to count the same.  What this method does provide is a quick and easy way to gauge the current margin in any given state using the knowledge base of every pollster's latest guess in that state.
We can't know until after the election which polls are nearest to the final result, but we can know which polls are nearest to the median poll spread and calculate house effects based on this.  I have calculated the median spread for every day since September 1 in 19 state presidential contests and 14 senate contests.  The average distance each poll's spread is from the calculated median spread provides the house effect.

The following are my calculated house effects for each pollster with three or more presidential polls in my limited database.

Pollster No. of
pres.
polls
No. of
senate
polls
House effect (D-R)
Susquehanna 4 4 -7.1
Gravis Marketing 25 13 -3.5
Baydoun/Foster 3 3 -2.8
ARG 15 0 -2.2
Rasmussen 63 46 -2.1
U. of Cincinnati 3 3 -1.8
Muhlenberg Coll. 4 4 -1.6
Mason-Dixon 10 8 -1.3
Civitas 3 0 -1.2
WeAskAmerica 15 9 -1.0
Survey USA 16 10 -0.8
Opinion Research 3 0 +0.0
MassINC 4 4 +0.1
Purple Strategies 5 0 +0.4
Fox News 6 5 +0.9
Suffolk U. 7 6 +1.2
PPP 57 32 +1.2
Marist 22 14 +1.3
Pharos Research Group 16 16 +1.4
Quinnipiac 19 17 +1.7
Marquette U. 5 5 +2.6
Detroit News 3 3 +3.8
Washington Post 4 4 +4.1
Epic-MRA 4 3 +4.4
UNH 4 0 +4.9

So if you read this morning that Rasmussen found the race in Wisconsin tied, you can guess that given Rasmussen's 2.1 point slant towards Republicans, Obama is actually up by 2.1 points there. 

I have found similar house effects to those published elsewhere, like these from Simon Jackman, which gives me confidence that I'm not just finding a bunch of hooey.

_________________

As of yesterday's polls, the median poll spread in the 9 battleground states plus Romney's Extended Map States (MI, PA, MN) are as follows:


State Obama Romney Spread EV
Minnesota 51 44 O+7 201
Wisconsin 51 46 O+5 211
Pennsylvania 49 45 O+4 231
Ohio 49 45 O+4 249
Michigan 48 45 O+3 265
Iowa 49 46 O+3 271
Nevada 50 47 O+3 277
New Hampshire 49 47 O+2 281
Colorado 47 47.5 R+0.5 257
Virginia 47 47.5 R+0.5 248
Florida 47 48 R+1 235
North Carolina 46 49 R+3 206

  •  The North Carolina number has grown more and more Romneyish this week, and a big part of that was a poll from the centrist Survey USA that showed Romney up 5. 
  •  Romney's margin in Virginia changed with the Roanoke College poll that was released yesterday. Roanoke College showed an 8 point Obama lead right before the first debate, and now shows a 5 point Romney lead. More impressively, Roanoke College went from a 10-point Tim Kaine lead over George Allen (highly implausible) to a 5-point George Allen lead over Tim Kaine (also highly implausible).  They swung from being a blue outlier to a red outlier in one of the largest poll-to-poll shifts I've seen in my database.
  • It almost doesn't matter about any other state besides Ohio at this point, and Obama's Ohio numbers constantly show him in the lead by a few percentage points
  • This Michigan number (Obama +3) is why my method of calculating a median spread may not be the best.  It's calculated from seven polls that show a margin of 0, 3, 4, 6, 6, 7, 8, but since the Obama numbers are 47, 48, 48, 48, 50, 52, 53 and the Romney numbers are 42, 42, 45, 45, 45, 46, 47, the spread is 3 instead of 6. 

Sunday, October 28, 2012

Late October Polling Update - Presidential Contest

Mitt Romney's momentum has stopped, speaketh Lord Silver from his throne inside the Castle of the Gray Lady.  And the high lord of poll analysis was right -- it has been a pretty good polling week for Barack Obama overall.  The following graphs show the median of the active independent polls in each of the presidential battleground states.  I'll do the senate races in a separate post.

The presidential election will come down to these 11 states.  Last week I ran down the numbers from the perspective of Mitt Romney, so in the interest of fairness I will do it from Barack Obama's perspective this time.  His baseline is 201 electoral votes.

Michigan (O+5) (based on 7 active polls) - Michigan remains unchanged from last week, as only one (outlier) poll by Baydoun/Foster was done this week.  That poll showed an improbable tie in Michigan, but the pollster has a 3.2 point Republican-leaning house effect, second in magnitude only to Susquehanna in my database.


Pennsylvania (O+4.5) (based on 10 active polls) - Pennsylvania remains mostly aspirational for Mitt Romney.  Five polls released this week in Pennsylvania ranged from Obama +3 to Obama +6.  With Michigan and Pennsylvania looking like they're in the bag for Obama, his electoral vote total becomes 237.


Ohio (O+4) (based on 17 active polls) - There are varying definitions for swing state, but they all include this one.  Nate Silver's computers say that Ohio has a 50-50 chance of deciding the election, which basically means it's as important as all the other states combined.  This is great news for Obama.  

Nine polls were published about Ohio this week, and Mitt Romney wasn't leading in any of them.  The last two polls that had showed a Romney lead came from ARG (R +2.3) and Gravis Marketing (R +3.1); both firms have done more recent polls showing either a tie (Gravis) or a 2 point Obama lead (ARG).  Adding 18 more electoral votes to the total, Obama has 255, 15 to go.


Wisconsin (O+4) (based on 7 active polls) - It would seem that the presidential race in Ohio would be closer than Wisconsin or Iowa judging by all the polling done in the Buckeye State, but all three of them show similar numbers.  Three polls were released in Wisconsin this week.  The latest one released on Friday showed a tie, but it was a Rasmussen poll (R +2.6).


Iowa (O+3) (based on 7 active polls) - Gravis Marketing (R +3.1) and PPP (D +0.5) apparently switched names just for their Iowa polling this week.  PPP showed Romney up 1 point last weekend, while Gravis just released a poll showing Obama up 4, which was only their third poll out of 23 in my database to show a spread bluer than the median.  With Wisconsin and Iowa, Obama would have 271 electoral votes and a second term. But he'll win at least one more state.


Nevada (O+3) (based on 8 active polls) - No 3-point margin has ever felt safer for Obama than his lead in Nevada.  Five new polls this week all showed slender leads for Obama, and it's a lead that just makes sense given the demographics of the state and the recent election history.  With Nevada, Obama would have 277 electoral votes.


New Hampshire (O+1) (based on 7 active polls) - New Hampshire had four new polls this week: two showed a change in Obama's favor from previous polls, one showed a change in Romney's favor from a previous poll, and one was a new entry that showed a 3-point Obama win.  If Obama were to pull off a victory in this Democratic-leaning state, he would have 281 electoral votes.


Virginia (O+0.5) (based on 12 active polls) - Just this evening Virginia tilted to Obama for the first time in 9 days based not only on the 4-point Obama margin in the Washington Post poll but also on the latest poll from Gravis Marketing exterminating an older poll showing Romney up five. Virginia is the last state I show Obama winning as of right now, and it would give him 294 electoral votes.
  

North Carolina (R+0.5) (based on 8 active polls) - North Carolina suffers from partisan polling divergence, similar to the Pennsylvania senate race.  You can see from the chart that there are two pollsters (Rasmussen and Gravis) that show Romney's support well over 50% in the Tarheel State.  ARG showed Romney's support back in September right at 50%, and there was one Civitas poll that had Romney's support at 53% in early September (a new Civitas poll put it at 48% this week).  The one firm that does not have a Republican bias that has polled North Carolina at all this month is North Carolina-based PPP, which has this race tied.  Yet most other poll aggregators show North Carolina as Romney country, with Obama having a better shot at winning Florida than at winning North Carolina.  I don't agree, and I wish we could see some updated polling numbers from Marist and Survey USA that could back this up.  It may be moot to the electoral college, but I think Romney will win North Carolina by less than 2 points if he wins it at all, and it certainly less than the 6-point and 8-point margins Rasmussen and Gravis are showing.


Colorado (R+1) (based on 10 active polls) - Four new polls came out this week, and they were literally all over the place.  Rasmussen had Romney by 4, but PPP had Obama by 4.  The trend in three of them though favored Romney, while the fourth (PPP) only barely favored Obama (+3 to +4).  Therefore Colorado moved from a tie last week to Romney +1 this week.
 

Florida (R+1) (based on 15 active polls) - Five new polls came out this week, and Obama was ahead in none of them (though he did manage a tie in the Pharos Research Group poll if you round to the nearest whole percent).  One glimmer of hope for Obama is that the latest poll that came out (Rasmussen) showed a three point swing from the week before towards Obama.  If Obama wins all these 11 battleground states, he will have 347 electoral votes.


After Florida, there is a steep jump to the next nearest state (Arizona, R+8), so I feel pretty confident that the universe of potential Obama victories has a rigid ceiling at 347 electoral votes.  

I will have more on the Senate races tomorrow.