So, you know how in part 1 I said that FiveThirtyEight
estimated that there would be 1,000 deaths at the hands of police each year? I
spent months researching this question using data from Killedbypolice.net (KBP) to
conclude … there were exactly 1,000 deaths due to a police officer’s lethal act
of force.
Not “around” 1,000. Exactly
1,000.
I didn’t set out to find 1,000. I didn’t interpret the data
more favorably in order to stretch the number to 1,000. It just happened that
way.

Of those 1,000 people killed by lethal acts of force, 938
were killed by gunfire, 39 were killed after being tased, and 23 died from
other causes like physical restraint or battery, like being placed in a
chokehold and taken to the ground (like Eric Garner).
The Bureau of Justice Statistics (BJS) found that from 2003 to
2005, 96% of homicides by police were caused by gunshots, though that figure
only includes known police homicides, making up 55% of all arrest-related
deaths, and does not include the 8% of arrest related deaths that were due to
unknown causes.[1]
Since the KBP data tends to include these unknown cause deaths as police
homicides, it makes sense that the percentage of gunshot deaths in my database
would be lower than the percentage in the BJS report.

95% of those who were killed by lethal acts of force in 2014
were males, and 5% were females.
This figure is similar to figures found from other
sources. The Bureau of Justice
Statistics report for the years 2003 through 2005 found 97% of decedents are
men, as did the FBI’s Supplemental Homicide Report for the same years.[2]
The BJS report for 2003-2009 found this number to be 95.4% men and 4.5% women.[3]
Tasers
In 126 incidents (13%), there is documented evidence of an
officer using a taser beforehand to try to attempt an arrest without having to
resort to gunfire. I tried to count each instance where a taser was fired by a
police officer, whether or not it connected with the decedent or was effective
at all. This number includes the 39
incidents where the cause of death was likely the taser, and four where the
taser was used, but the decedent died by some other means. Two of the 39 people (5%) who died after
being tased were women (Iretha Lilly of Waco, Texas, and Jennifer Bond, who
died while traveling in Kentucky).
Veronica Canter of Fresno was the only example of a female who died from
police gunfire after having been tased.

This number of 126 uses of tasers is likely an undercount.
On a few occasions I found that the media did not report that an officer used a
taser to try and subdue the decedent before he or she was shot, but the taser
use was later revealed when the district attorney released a report about the
investigation. But in most of these
incidents, a report was never released publicly by the district attorney,
leaving the media’s post-incident report as the narrative-of-record.
There isn’t much data out there to compare this figure of
13% to. The 2003-2005 BJS Arrest-Related
Deaths report found 36 incidents where a taser was involved, and in 17 of those
cases the taser was the cause of death.[4] The report did not list a percentage of
arrest-related deaths that a taser was used in.
The San Diego County District Attorney’s office released a study
analyzing all officer-involved shootings between 1993 and 2012. In this report,
the attorney’s office found that tasers were used in 9 of the 358 shooting
events, which is 2.5% of all shootings.[5]
I found tasers were used in 83 of the 938 shootings nationwide, which is a rate
of 9.1%. Considering how tasers weren’t
even used by police before 1998, it is not surprising that my count would be
higher than the San Diego count that includes data from as far back as 1993.[6]
There is some controversy over the citation of tasers as a
cause of death. Before 2014, a taser (or rather, a conducted electronic device
similar to the one manufactured by TASER International, which I’m going to
continue to call a “taser” with a lower-case t, sorry red squiggly line) had never
been cited in an official cause of death report in Florida.[7]
Most of the people in Florida who had been killed by the police and had been
tased got documented as having died from “excited delirium”, which is brain
malfunction, quite rare, that makes people highly aggressive and full of
feverish rage. It’s so rare in fact that almost all reported cases of someone
having “excited delirium” involve people involved in a physical struggle with
police.[8]

I found that people who died due to a police officer’s taser
were more likely to have been black than any other race. Though black people only account for about 12.5%
of the population of the United States, they accounted for 46% of the deaths
due to tasing in 2014. This was similar
to the percentage of deaths of black people due to tasers found by the BJS
report on arrest-related deaths from 2003 to 2005. In that report, the BJS
found that 48.5% of taser-related deaths happened to black people, while 45.5%
happened to white people and 6.1% (2 incidents) happened to Hispanic or Latino people.
Physical struggles

A physical struggle
took place in 163 incidents of lethal acts of force in 2014 (16%). This counts basically any touch of the police
officer on the decedent where the officer attempted to restrain, kick, punch,
hold down or grab the decedent, no matter who started the fight. Batons count as a physical struggle for these
purposes.
Of those 163 incidents, 114 people died from police
officers’ gunshots later, while 27 people died after being tased. 22 people who
were entangled in a physical struggle with police died from non-gunshot,
non-taser related injuries likely caused by police. Not counted as a physical struggle but
counted as a non-gunshot non-taser death was the May 24 death on Skid Row of Carlos Ocana
by the Los Angeles Police Department. Ocana had
climbed up a billboard on top of a roof. He had come down from the billboard on
his own, but then he became spooked by the SWAT team’s guns and started to clamber
back up. LAPD officers tased him, and Ocana lost his grip. Ocana plummeted to
the asphalt below, where an inflatable pad had been placed, but in the wrong
location.[9]
The death was an accidental death, but the use of force in that incident was
not accidental.
Race
I tried to attribute a race to each decedent found in the
KBP database. KBP had already found the race of the decedent in 38% of the
cases (376) at the time I scraped the data, which was late December of 2014.
The task of finding the race in the remaining 624 incidents often took up a lot
of time. Most law enforcement agencies
don’t release the race of the person they killed, and most pieces from media
sources don’t include the information in any narrative, though frequently a
driver’s license picture or recent booking photo of the decedent will be
included in the article, and occasionally these will have been missed by the
KBP data.
I had to use my best internet searching skills (partially
learned from one of my other hobbies, genealogy) to find the answer to the
question of race. Sadly one great source of information was Mugshots.com, especially for decedents who had a criminal history and an unusually unique name. Obituaries and funeral
notices were also a particularly good source of information on race. Funeral homes frequently post a picture of the
decedent and an age and date of death, which can be used to confirm the
identity of the decedent. However there were many obituaries where no picture was included. For
those I had to try to find the race of the family members mentioned in the
obituary, in particular siblings and children rather than spouses, which can give the possibility of a false positive due to interracial coupling. Yes, I used publicly available social network
profiles on a few occasions to track down family members in order to determine
the race of the decedent. In about 40
incidents I used an assumption about the likely race of the decedent, but only
where a strong ~80% sure assumption could be made based on the neighborhood
where the decedent lived, the name of the person, and the circumstances of the incident. Still, I was unable to
confirm the race of the decedent in 31 of the lethal act of force incidents in
2014.
I used the classification scheme that the BJS uses in their
Arrest-Related Deaths report. “White” for this project means non-Hispanic white.
“Black” similarly means non-Hispanic black.
Unlike the BJS, I placed people with more than one race or
ethnicity into one race or another based on a chronological sequence. That is,
I went down the list in chronological order, placing the first person in the
“white” category and the second in the “Hispanic or Latino” category, for
instance. I did this for mathematical reasons. At first I just classified
people as more than one race, but I realized that this would lead to a higher
rate of death for a given race than is reflected in reality. I also didn’t want
to classify bi-racial people as a different race called “other” because then
the statistics for each of these incidents would be lost to the bucket of
“other”ness where one can’t use data to see trends because the data isn’t
reflective of any single race. There
were 19 people I identified as being bi-racial (or bi-ethnic): 3 were white and
black, 14 were Hispanic and non-Hispanic white, one was Asian and white, and
one was Hispanic and Native American.
Through my partitioning method, these incidents became categorized as
occurring to 2 black people, 7 Hispanic or Latino people, 1 native American and
9 white people.

For all deaths caused by a police officer’s lethal act of
force, 266 were black, 486 were white, 185 were Hispanic or Latino, 14 were
Asian, 13 were Native American, and 36 were unknown or another race. Excluding those whose race was unknown, the
percentages change very little.

The BJS found that the racial breakdown for police homicides
from 2003 to 2005 was 44.8% white, 29.9% black, 20.2% Hispanic or Latino, and
5.1% for all others.[10]
Their report for 2003 to 2009 showed 41.7% white, 31.7% black, 20.3% Hispanic
or Latino, and 6.4% for all others.[11]
My analysis for 2014 shows more white people and fewer people of color than the
BJS reports. My theory is that the gaps in the numbers for BJS data come from
sheriff’s offices and small town police departments, which are demographically
more likely to be responsible for the deaths of white people.
Age
I found that the average age of people who died due to an
officer’s lethal act of force in 2014 was 35.9 years, while the median decedent
was 34 years old.
Median age
|
Average age
|
Most frequently occurring age
|
|
All lethal acts of force
|
34
|
35.9
|
27
|
Gun deaths only
|
34
|
35.8
|
29
|
Taser deaths only
|
37
|
35.8
|
30
|
The BJS report on data from 2003 to 2005 and the FBI’s supplemental
homicide report for the same time frame found the average age was 33 years old.[12]
The age group with the most deaths in 2014 was the 24 to 29
year old range, with 194 people killed.

Death rate
I found that the rate of death for the entire country in
2014 was 3.14 people per million. But the rate varied by race and age.

Jaeah Lee, in a piece for Mother Jones, looked into the BJS
report from 2003 to 2009 and found that black people were killed at an average
annual rate of 3.66 deaths per million, while white people were killed at an
average annual rate of 0.90 deaths per million.[13] The rates I found are higher than Lee’s.
Death rate per million per year
|
As found by Jaeah Lee using BLS data from 2003-2009
|
My analysis
|
% difference
|
Black
|
3.66
|
6.67
|
182%
|
Hispanic or Latino
|
1.92
|
3.41
|
178%
|
White
|
0.90
|
2.36
|
262%
|
While it seems that the BLS data undercounts all races, it
undercounts white decedents more than black and Hispanic or Latino decedents.
This is not to say that white people are more likely to die than black people,
just that black people may only be three times as likely to die from a police
officer’s lethal act of force than a white person, rather than four times as
likely, as Lee stated in her article.
The rate is much higher for men than for women, and much
higher for black men than for white and Hispanic men.
Males, death rate per million per year
|
Females, death rate per million per year
|
|
All (n=1000)
|
5.9 (n=947)
|
0.3 (n=53)
|
White (n=483)
|
4.4 (n=451)
|
0.3 (n=32)
|
Hispanic (n=184)
|
6.4 (n=177)
|
0.3 (n=7)
|
Black (n=264)
|
13.0 (n=255)
|
0.4 (n=9)
|
And the rate is higher for young men than for older men, and
higher for young black men than for young white and young Hispanic men.
Death rate per million per year
|
10 to 17 year old males
|
18 to 34 year old males
|
35 to 64 year old males
|
65 year old males and older
|
All
|
0.9 (n=16)
|
12.0 (n=462)
|
6.7 (n=424)
|
1.7 (n=32)
|
White
|
0.3 (n=3)
|
8.1 (n=180)
|
5.7 (n=245)
|
1.5 (n=23)
|
Hispanic
|
1.3 (n=5)
|
12.1 (n=99)
|
8.1 (n=71)
|
1.5 (n=2)
|
Black
|
2.7 (n=7)
|
30.6 (n=159)
|
11.5 (n=83)
|
4.0 (n=6)
|
While young (18 to 34 year old) black men account for only
2% of the population of the United States, they accounted for 16% of decedents
killed by lethal acts of police force in 2014.

ProPublica ran an analysis in October of 2014 that compared
the rate at which white teenagers get killed to the rate that black teenagers
get killed. Using FBI data they found
that white males between 15 and 19 years old got killed by police at a rate of
1.47 per million over the three year time period between 2010 and 2012, while
black males between 15 and 19 years old got killed by police at a rate of 31.17
per million.[14] Given that this rate was over a three year
time period, I’ll make an assumption that the annual rate can be found by
dividing by three in order to compare it to my analysis. ProPublica’s rate per million was therefore
0.49 per year for white males between 15 and 19 years old, while the rate per
million for black males of the same age range was 10.39 per year.
I found a similar death rate per million for black teenage
males, but the rate of white teenage males I found was approximately three
times higher than what ProPublica found.
Death rate per million per year, males only, 2014
|
Number of deaths, ages 15 to 19
|
Rate per million per year, ages 15 to 19
|
All
|
45
|
3.9
|
White
|
12
|
1.8
|
Hispanic
|
12
|
4.9
|
Black
|
18
|
10.2
|
The authors of the ProPublica study did not emphasize the
absolute rate per million but rather the difference in likelihood of death
between black teenagers and white teenagers. They said that black teenagers
were 21 times more likely to be killed by police than a white teenager. After
some experts criticized their analysis in part for using such flawed data,
ProPublica looked at other three-year chunks of FBI data to see if there were
similar black-to-white risk ratios in prior years. They found that the rate had
been as low as 9 times more likely and as high as 21 times more likely going
back to 2006.[15]
I found that black teenagers were 5.5 times more likely to
be killed by police in 2014 than white teenagers of the same age. I attribute
this lower rate to the fact that the police forces most likely to report data
to the FBI are also the police forces most likely to have committed a lethal
act of force against a black person; that is, larger forces from big cities.
The biggest racial disparity I found in terms of relative
likelihood of dying due to police lethal acts of force was over the age range
of 20 to 24. For 2014, I found that black males in that age range (at a rate of
34.0 deaths per million per year) were 6.9 times more likely to die from a
police officer’s lethal act of force than a white male between 20 and 24 (4.9
deaths per million per year).

Deaths in 2014 in the US by police lethal acts of force, males only, by age group
|
All
|
White
|
Hispanic or Latino
|
Black
|
0 to 4
|
0
|
0
|
0
|
0
|
5 to 9
|
0
|
0
|
0
|
0
|
10 to 14
|
3
|
0
|
1
|
2
|
15 to 17
|
13
|
3
|
4
|
5
|
18 to 19
|
32
|
9
|
8
|
13
|
20 to 24
|
133
|
33
|
35
|
58
|
25 to 29
|
166
|
75
|
33
|
51
|
30 to 34
|
131
|
63
|
23
|
37
|
35 to 44
|
218
|
112
|
43
|
53
|
45 to 54
|
154
|
96
|
21
|
25
|
55 to 64
|
52
|
37
|
7
|
5
|
65 to 74
|
26
|
17
|
2
|
6
|
75 to 84
|
5
|
5
|
0
|
0
|
85 and over
|
1
|
1
|
0
|
0
|
Deaths per million per year, males only, by age group, in 2014 in the US
|
All
|
White
|
Hispanic
|
Black
|
0 to 4
|
0.0
|
0.0
|
0.0
|
0.0
|
5 to 9
|
0.0
|
0.0
|
0.0
|
0.0
|
10 to 14
|
0.3
|
0.0
|
0.4
|
1.3
|
15 to 17
|
1.9
|
0.8
|
2.8
|
4.9
|
18 to 19
|
6.6
|
3.4
|
7.9
|
17.5
|
20 to 24
|
11.2
|
4.9
|
14.1
|
34.0
|
25 to 29
|
14.8
|
11.6
|
13.8
|
35.9
|
30 to 34
|
12.2
|
10.1
|
10.0
|
27.9
|
35 to 44
|
10.2
|
8.6
|
10.7
|
20.5
|
45 to 54
|
6.7
|
6.1
|
7.0
|
9.3
|
55 to 64
|
2.7
|
2.6
|
4.0
|
2.6
|
65 to 74
|
2.3
|
1.9
|
2.4
|
6.3
|
75 to 84
|
0.9
|
1.0
|
0.0
|
0.0
|
85 and over
|
0.5
|
0.6
|
0.0
|
0.0
|
A note on population figures
I tried to use US Census data for population numbers broken
down by race, but these have not yet been published for 2014. Instead I used
the race and age breakdown from the 2009-2013 American Community Survey (ACS) and
“scaled up” to the total number of people from the 2014 US census data. This
method is simple but it assumes that the proportion of each race and age
category remains constant year over year, which would not be true. I also chose
to distribute people who were “more than one race” and “some other race”
proportionally to each race and age group in the same way.
2009-2013 ACS census population
|
2014 Census estimate for purposes of finding rates of death
|
|
Non-Hispanic white alone
|
197,050,418
|
206,312,263
|
Hispanic (any)
|
51,786,581
|
54,220,675
|
Non-Hispanic black alone
|
38,093,998
|
39,884,508
|
Non-Hispanic Asian alone
|
15,061,411
|
15,769,334
|
Non-Hispanic American Indian alone
|
2,061,752
|
2,158,659
|
Non-Hispanic Pacific Islander
alone
|
488,646
|
511,614
|
Sum
|
304,542,806
|
318,857,053
|
Census total
|
311,536,594
(including people of more than one race and people of “some other race”) |
318,857,052
(from US Census estimates for 2014) |
Armed
Overall, 18% of people killed by a police officer’s lethal
act of force in 2014 were unarmed.

This figure includes deaths caused not only by gunshot, but
also by taser or through some other means.
The vast majority of deaths caused by a taser discharge were
against unarmed people.

This is expected, and I think it’s important confer a lesser
degree of culpability on the officer involved in a death by taser, since the
officer never intended to use lethal force. But when an officer uses a real
firearm, like Officer Darren Wilson in Ferguson, he or she generally intends on
killing the person. And yet still, 13% of those who died from officer gunfire
in 2014 were unarmed. That’s 119 people.

There was a difference depending on the decedent’s
race. 62% of the white people who died
due to a lethal act of force had guns, and 14% were unarmed. Only 51% of black
people who died due to a lethal act of force had guns, and 25% were unarmed.
For Hispanic people, only 48% of those killed by police had guns, and 20% were
unarmed.


Since taser deaths had a tendency in 2014 to occur to black
people more than to white people or Hispanic or Latino people, and since those
who died by tasers were overwhelmingly unarmed, one would expect the number of
unarmed people who died by lethal acts of force to be at an increased level for
black people than for white people and Hispanic people due to this taser
effect. But the racial disparity in
unarmed killings is still present even when gunshot deaths are isolated.


While only 10% of gunshot deaths of white people were to
those not carrying arms, 17% of the gunshot deaths of black people happened to
unarmed people. And unarmed Hispanic
people were killed at almost the same rate, 16%, while barely half of the
Hispanic deaths involved people with guns, the lowest of these three
race/ethnicity categories.
It is difficult to strike a comparison with any published
data to these numbers. The BJS report for the data collected between 2003 to
2005 found that in 80.1% of the arrest-related homicides committed by police
the arrestee had used a weapon to threaten or assault officers.[16] For my analysis, this number would be
somewhat comparable to the 82% of people who were armed, although I include in
that total people who weren’t threatening officers but were only threatening or
assaulting other victims when they were shot by police (5% of the incidents).

Viewing the data another way, I analyzed the race of the
weapon-carrying decedents. Of all the gun-toting people who were killed by a
lethal act of force in 2014, 54% were white and only 25% of them were black.
But of all the unarmed people killed by a lethal act of force in 2014, just 38%
were white and 37% were black.


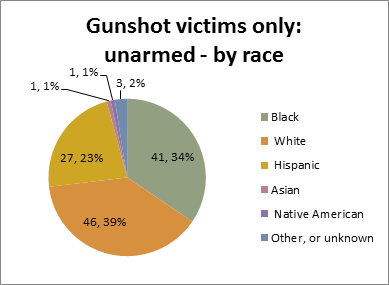
Focusing in only on gunshot victims, the percentage of unarmed
people who were black shrinks, but only to 34% compared to 39% of unarmed
people who were white.
These are the crosstabs.
All acts of force, 2014
|
Total
|
Black
|
White
|
Hispanic
|
Asian
|
Native American
|
Other, or unknown
|
Had a gun
|
553
|
136
|
301
|
89
|
3
|
7
|
17
|
Had a knife
|
182
|
39
|
85
|
36
|
9
|
5
|
8
|
Had a car
|
61
|
19
|
25
|
11
|
1
|
0
|
5
|
Had another weapon
|
28
|
6
|
8
|
12
|
0
|
0
|
2
|
Unarmed
|
176
|
66
|
67
|
37
|
1
|
1
|
4
|
All acts of force, 2014
|
Total
|
Black
|
White
|
Hispanic
|
Asian
|
Native American
|
Other, or unknown
|
Had a gun
|
100.0%
|
24.6%
|
54.4%
|
16.1%
|
0.5%
|
1.3%
|
3.1%
|
Had a knife
|
100.0%
|
21.4%
|
46.7%
|
19.8%
|
4.9%
|
2.7%
|
4.4%
|
Had a car
|
100.0%
|
31.1%
|
41.0%
|
18.0%
|
1.6%
|
0.0%
|
8.2%
|
Had another weapon
|
100.0%
|
21.4%
|
28.6%
|
42.9%
|
0.0%
|
0.0%
|
7.1%
|
Unarmed
|
100.0%
|
37.5%
|
38.1%
|
21.0%
|
0.6%
|
0.6%
|
2.3%
|
Died by gunshot only, 2014
|
Total
|
Black
|
White
|
Hispanic
|
Asian
|
Native American
|
Other, or unknown
|
Had a gun
|
553
|
136
|
301
|
89
|
3
|
7
|
17
|
Had a knife
|
181
|
39
|
84
|
36
|
9
|
5
|
8
|
Had a car
|
60
|
19
|
24
|
11
|
1
|
0
|
5
|
Had another weapon
|
25
|
5
|
7
|
11
|
0
|
0
|
2
|
Unarmed
|
119
|
41
|
46
|
27
|
1
|
1
|
3
|
Died by gunshot only, 2014
|
Total
|
Black
|
White
|
Hispanic
|
Asian
|
Native American
|
Other, or unknown
|
Had a gun
|
100.0%
|
24.6%
|
54.4%
|
16.1%
|
0.5%
|
1.3%
|
3.1%
|
Had a knife
|
100.0%
|
21.5%
|
46.4%
|
19.9%
|
5.0%
|
2.8%
|
4.4%
|
Had a car
|
100.0%
|
31.7%
|
40.0%
|
18.3%
|
1.7%
|
0.0%
|
8.3%
|
Had another weapon
|
100.0%
|
20.0%
|
28.0%
|
44.0%
|
0.0%
|
0.0%
|
8.0%
|
Unarmed
|
100.0%
|
34.5%
|
38.7%
|
22.7%
|
0.8%
|
0.8%
|
2.5%
|
A note on privacy
I have found the vast majority of the victim names through
information published by local media and aggregated by Killedbypolice.net, with
the exception of a handful of names in the Houston region that were never
released publicly. These Houston names
do appear in the Texas Attorney Generals Custodial Deaths Report, mandated by
state law to be released to the public.[17] All the officer names I have found published
in local media after the information was allowed to be released by the local
police departments, or sometimes through the investigative reports released to
the public by district attorneys and prosecutors.
In most instances, the victim’s name is only released to the
public after the victim’s family has been informed of the victim’s death. In
many cases, the officer’s name gets released to the public only after the
officer consents to it being released, but it varies by jurisdiction. The name
of the officer or officers involved has been released in only 53% of the
incidents in my database. A California
Supreme Court ruling in 2014 found that the public has a right to know the
names of police officers involved in on-duty shootings unless specific safety
concerns against officers, not vague assertions of possible threats, could be
articulated.[18]
I agree with the opinion of the California Supreme Court,
that a public has a right to know the identity of the police officer involved,
a public figure who wears his name on his uniform as he goes about doing
service for the public. And I feel that
not disclosing the names of the victims does a disservice to the public in
terms of the ability to investigate and research police use of force.
Throughout this essay, I use both the names of the victims and the names of the
officers involved in the shooting.
[1]
Mumola, Christopher J. “Arrest-Related Deaths in the United States, 2003-2005”.
Bureau of Justice Statistics, October 11, 2007. http://www.bjs.gov/index.cfm?ty=pbdetail&iid=379
[2]
Mumola, Christopher J. “Arrest-Related Deaths in the United States, 2003-2005”.
Bureau of Justice Statistics, October 11, 2007. http://www.bjs.gov/index.cfm?ty=pbdetail&iid=379
[3]
Burch, Andrea M. “Arrest-Related Deaths, 2003-2009 – Statistical Tables”.
Bureau of Justice Statistics, November 17, 2011. http://www.bjs.gov/index.cfm?ty=pbdetail&iid=2228
[4]
Mumola, Christopher J. “Arrest-Related Deaths in the United States, 2003-2005”.
Bureau of Justice Statistics, October 11, 2007. http://www.bjs.gov/index.cfm?ty=pbdetail&iid=379
[5]
“Officer-Involved Shooting Review: Analysis of Cases Reviewed by the San Diego
County District Attorney’s Office 1993-2012”. San Diego County District
Attorney’s Office, December 2014. http://www.sdcda.org/files/OIS_20YrReport_Final.pdf
[6]
Markos, Kibret. “Stun Guns Catch On Slowly With N.J. Cops”. The Record,
December 13, 2014. http://www.northjersey.com/news/stun-guns-catch-on-slowly-with-n-j-cops-1.1152867?page=all
[7]
Ovalle, David, and Charles Rabin. “Teen Shot By Miami Beach Police Taser Died
of Accidental Cardiac Arrest”. Miami Herald, March 6, 2014. http://www.miamiherald.com/news/local/community/miami-dade/article1961084.html
[8]
Sullivan, Laura. “Death By Excited Delirium: Diagnosis or Coverup?” NPR,
February 26, 2007. http://www.npr.org/templates/story/story.php?storyId=7608386
[9]
Holland, Gale. “Skid Row Residents Criticize LAPD After Death of Mentally Ill
Man”. Los Angeles Times, July 2, 2014. http://www.latimes.com/local/lanow/la-me-ln-skid-row-death-20140702-story.html
[10]
Mumola
[11]
Burch
[12]
Mumola
[13]
Lee, Jaeah. “Here’s the Data That Shows Cops Kill Black People at a Higher Rate
Than White People”. Mother Jones, September 10, 2014. http://www.motherjones.com/politics/2014/08/police-shootings-ferguson-race-data
[14]
Gabrielson, Ryan, Ryann Grochowski Jones, and Eric Sagara. “Deadly Force, in
Black and White”. ProPublica, October 10, 2014. http://www.propublica.org/article/deadly-force-in-black-and-white
[15]
Gabrielson, Ryan, and Ryann Grochowski Jones. “Answering the Critics of Our
Deadly Force Story”. ProPublica, December 24, 2014. http://www.propublica.org/article/answering-the-critics-of-our-deadly-force-story
[16]
Mumola
[17]
“Custodial Death Reports”. Attorney General of Texas Ken Paxton’s public
website. https://www.texasattorneygeneral.gov/criminal/custodial/report_deaths.php
[18]
Puente, Kelly. “Court: Names of Officers in Shootings Should Usually Be
Public”. Orange County Register, May 29, 2014. http://www.ocregister.com/articles/officers-616324-officer-court.html
No comments:
Post a Comment